
Turning diversion data into ESG reporting: a framework guide.
Sustainability reports carry a waste line, and in most organizations that line is an estimate. It is built from container size, collection frequency and an assumed density, which produces a single figure covering every material in the container and, often, several buildings at once. Energy and water data arrive from a meter. Waste data usually does not.
We weigh every container at pickup and record the result against the location it came from.
This guide sets out how that data maps to the environmental, social and governance (ESG) reporting frameworks commercial teams work with most often, which figure belongs where, and where our data stops.
The frameworks below are the common ones rather than a complete list, and the same weighed data supports any framework that asks for diversion by weight.

Why waste is the weakest line in most reports.
Hauler reporting describes service rather than material. A hauler records container volume and the number of collections, and weight is derived from those figures using an assumed density. That is enough to plan collections. But it is a weaker basis for a report, because the density figure is applied to the container rather than measured from what is in it, so the weight is inferred rather than recorded.
Three problems follow. The figure cannot be separated by material, so food waste cannot be distinguished from cardboard or general trash. It frequently cannot be separated by building, which matters for any organization reporting per asset, per campus or per property. And an inferred weight carries an uncertainty that invites questions during review.
Reporting frameworks have moved toward measured weight in response. Leadership in Energy and Environmental Design (LEED) removed the volume option from its operations and maintenance rating system and now requires waste to be tracked by weight. The Greenhouse Gas Protocol (GHG Protocol) asks for mass of waste by treatment method.
What we measure.
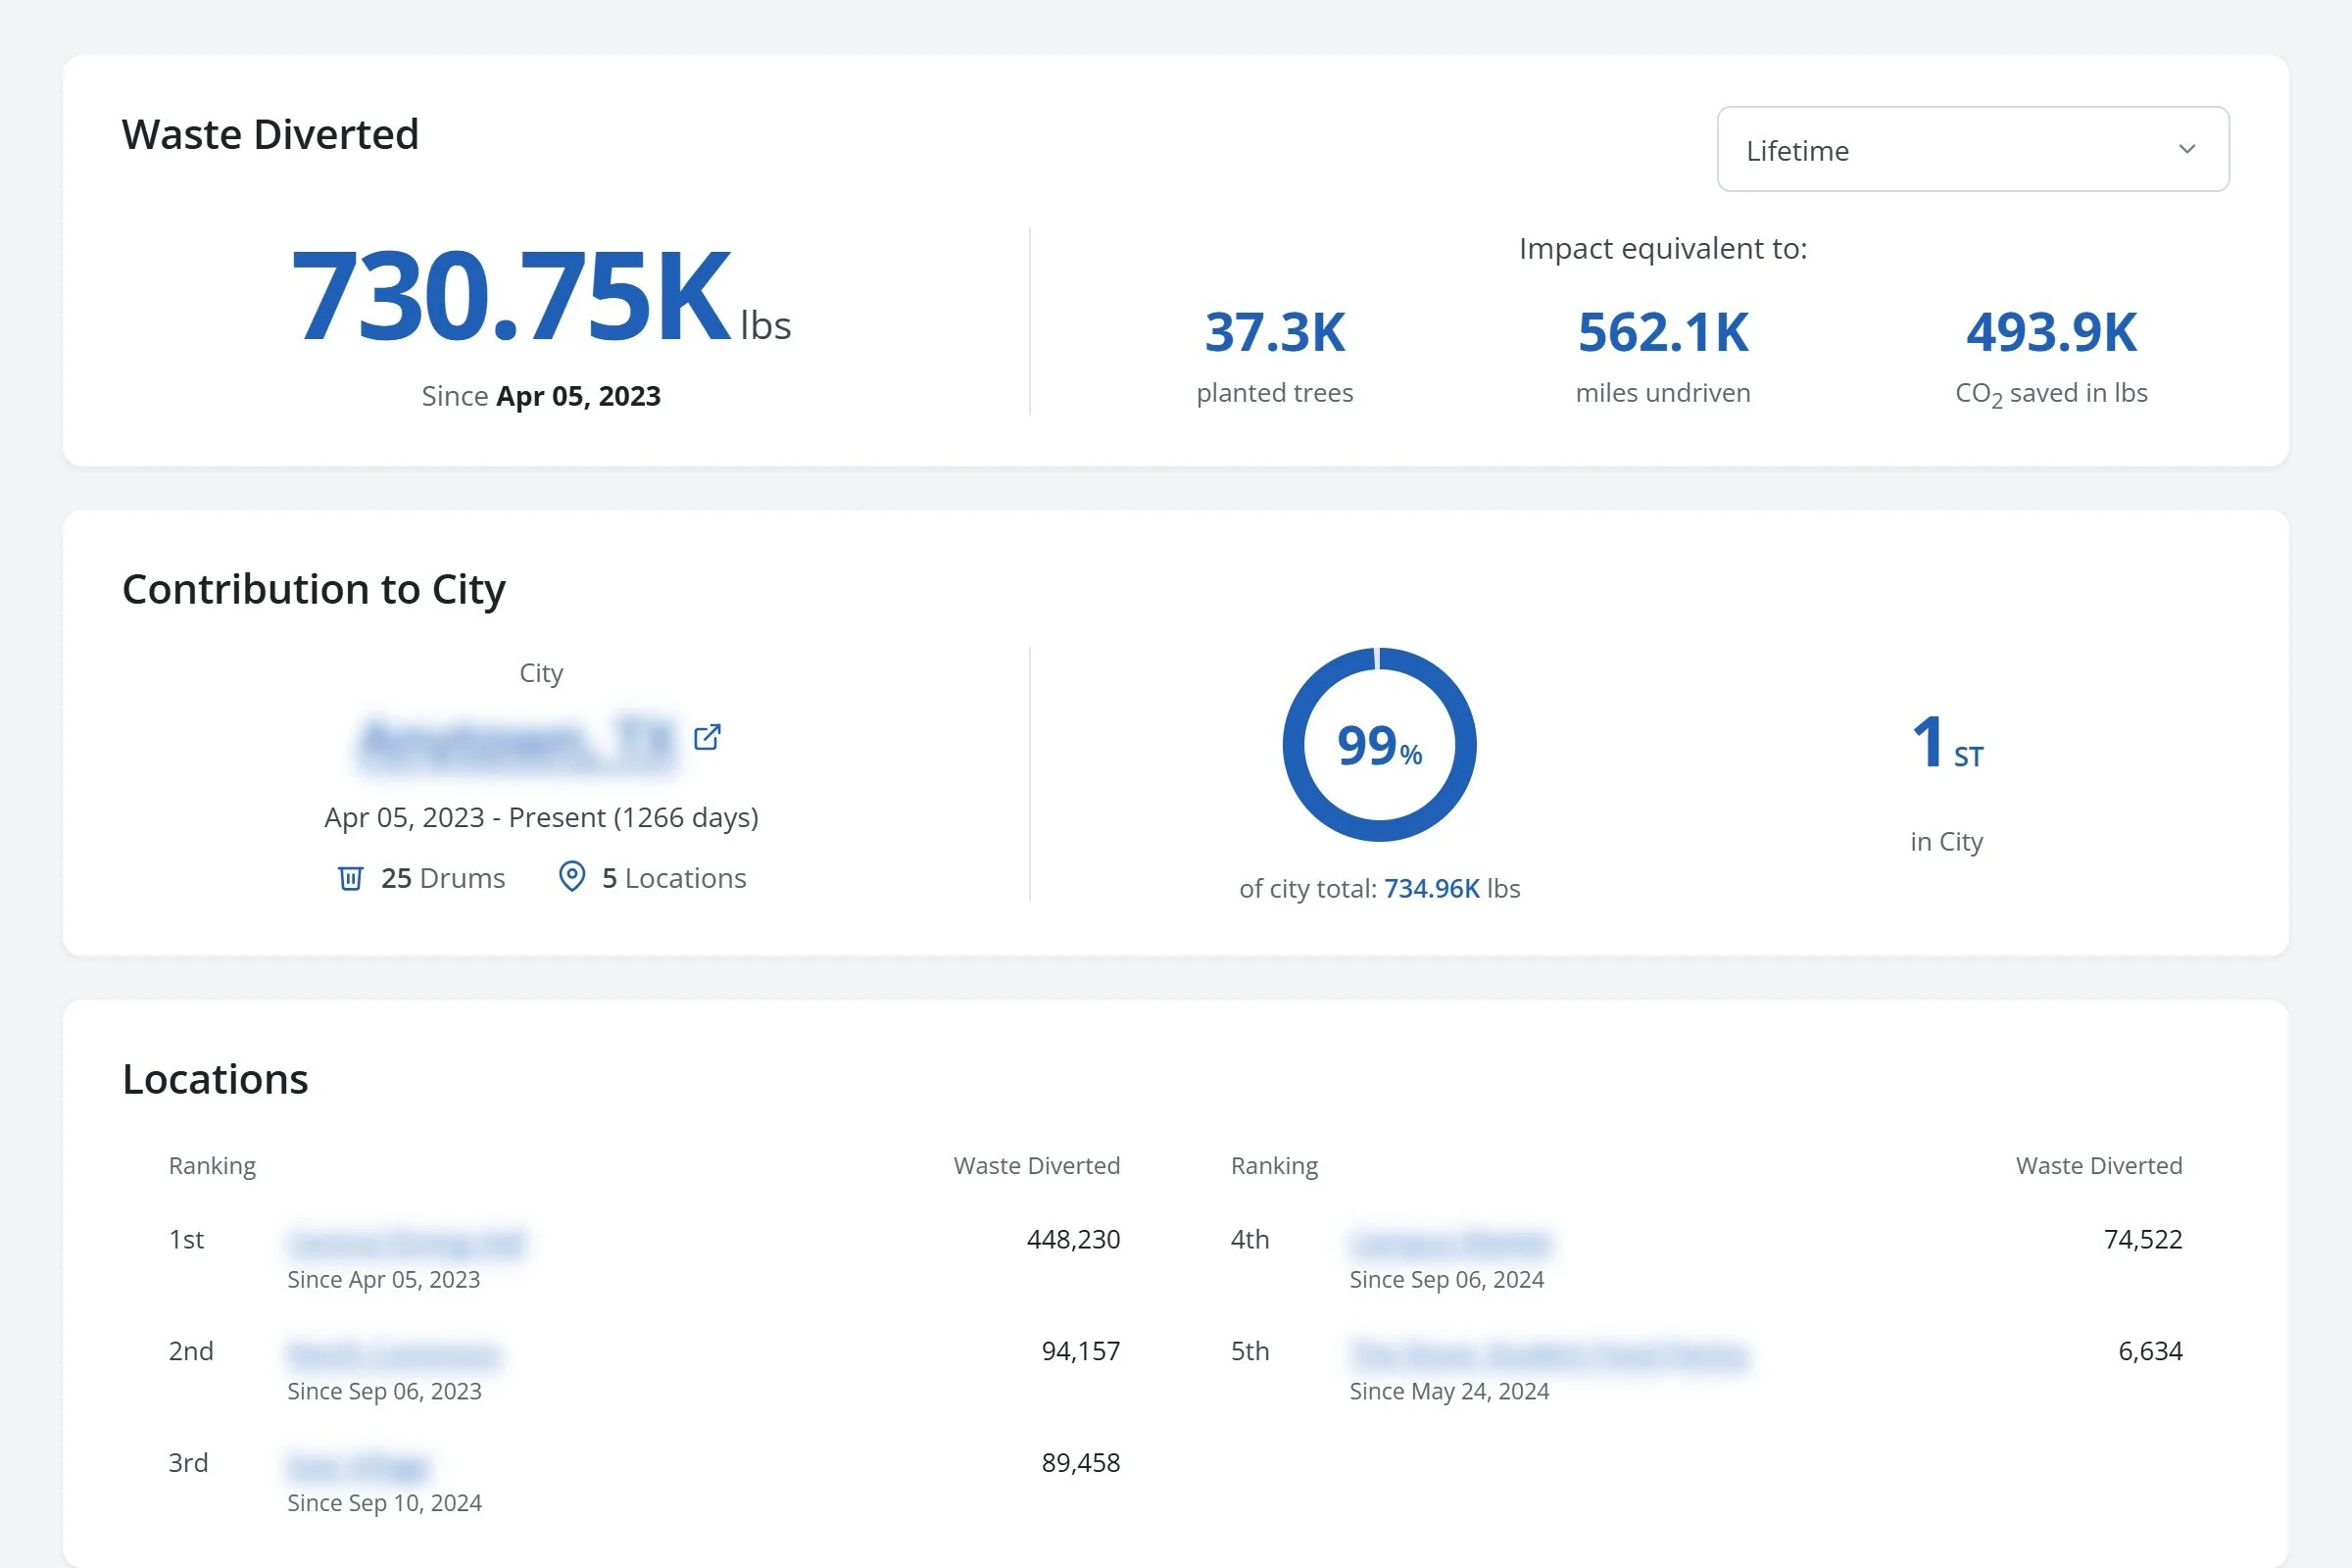
We weigh every container at pickup and record the weight against the location it came from. Weights are updated weekly and reported monthly. Your Diversion Dashboard is available at any time and requires no login.
The dashboard holds:
Your total pounds of food waste diverted, across all locations
Per-location totals, with comparison between locations
Environmental equivalencies for CO2, miles not driven and trees planted
A 12-month graph showing totals by location
A toggle between the current month and all-time diversion
Material we collect from your site is delivered to industrial composting facilities permitted by the Texas Commission on Environmental Quality (TCEQ) for aerobic processing. In reporting terms this is the disposal route, and most frameworks ask for it directly after the tonnage.
Custom reporting is available on request, depending on your reporting need. Where you need the data in a particular format, for a particular boundary or period, we can work with you to produce it.
Where the equivalency figures come from.
The environmental equivalencies on your dashboard come from the Waste Reduction Model, known as WARM, published by the Environmental Protection Agency (EPA). WARM is freely available and is the common reference for waste-related emissions factors in the United States.
Two adjustments are worth knowing about, because a reviewer may ask about either one.
WARM publishes its factors on a per-ton basis. We report diversion in pounds, so we convert the factors to a per-pound basis to match the data on your dashboard.
The tree equivalency needed further work. WARM expresses carbon uptake separately for an average deciduous tree and an average coniferous tree, each measured across its own average lifetime, and those lifetimes are not the same. We combined the two and expressed the result as the annual uptake of a single average tree, so that a year of diverted food waste is compared against a year of tree growth rather than against a full tree lifetime.
Two figures, two different uses.
Your dashboard produces two kinds of numbers, and they belong in different parts of a report.
Pounds diverted is measured activity data. It is the figure for a waste inventory, a diversion rate, or a Scope 3 category 5 calculation.
The environmental equivalencies are calculated, and they describe impact avoided rather than impact emitted. They suit communication: a board update, a leasing brochure, a campus newsletter, an annual impact report.
Framework by framework.
Scope 3, category 5 (GHG Protocol)
Any organization maintaining an emissions inventory, including grocery stores and corporate headquarters.
Category 5 covers emissions from third-party treatment and disposal of waste generated in your operations. Composting is one of the named treatment methods, alongside landfill, recycling, incineration and waste to energy.
The category requires mass of waste by type and treatment method, together with the share going to each route. Our weighed pickup data provides that input for your food waste stream.
The guidance also ranks data quality, placing supplier-specific data ahead of waste-type-specific data and averages. Our weights improve the quality of your activity data. They are not an allocated emissions figure from us, which is a separate thing.
Pounds convert to short tons or metric tonnes depending on which unit your inventory uses.
GRESB
Multifamily, property management and corporate headquarters portfolios reporting to institutional investors.
The GRESB Real Estate Assessment scores waste through indicators covering data availability, waste generation and disposal routes.
Two consequences follow. Data availability is scored separately from performance, so holding a measured number carries value on its own. Disposal routes require the split between where material actually went, which is what weighing a separated stream provides.
GRESB reports at asset level, and that is the breakdown that matters here. We record every weight against the location it came from, so each property carries its own figure. Your portfolio total is the sum of those same weighed figures rather than a separate estimate, which means your consolidated reporting and your per-asset reporting reconcile.
LEED for existing buildings: Operations and Maintenance (O+M)
Corporate headquarters, property management and multifamily buildings pursuing or maintaining certification.
Under LEED v4.1 O+M, waste is a prerequisite rather than an optional credit. Waste Performance requires a full year of data, 365 days, or a waste audit conducted during the year.
Weight is the accepted basis, as the volume option has been removed. Composting counts as diversion, and the calculation requires total weight generated alongside total weight diverted from landfill and incineration.
We supply the diverted-weight side for food waste. The generation total comes from your hauler or from an audit.
AASHE STARS
Universities and colleges submitting a sustainability rating.
The Sustainability Tracking, Assessment and Rating System (STARS), run by the Association for the Advancement of Sustainability in Higher Education (AASHE), places waste in OP 12, Waste Generation and Recovery, in its current version. The credit asks for metric tonnes, uses the most recent annual data from within the previous three years, and scores indicators including diversion percentage. Compostable material is explicitly within the reported scope.
Institutions still reporting under STARS 2.2 will find waste at OP 18, Waste Minimization and Diversion, which works from a baseline year and a performance year.
In either case the practical step is conversion, since STARS asks for metric tonnes and your dashboard reports pounds.
Practice Greenhealth
Hospitals and health systems applying for recognition.
Practice Greenhealth is a membership and awards program rather than a disclosure framework, and the mechanic that matters is the application cycle. Applications open in the fall and close the following spring.
For a hospital this makes the start date consequential. A spring deadline requires weighed data covering the preceding year, so a facility beginning collection in spring is a full cycle behind.
ISO 14001
Industrial and manufacturing sites, hospitals, and any certified facility.
ISO 14001 differs from the others in kind. It does not prescribe metrics. It requires an environmental management system, with monitoring, measurement and tracking against the objectives you set.
Weighed diversion data serves both purposes. It provides evidence that a stated objective is being measured rather than asserted. The current version of the standard also makes upstream and downstream impacts across the life cycle an explicit consideration, which places the treatment of your waste after it leaves your dock inside the management system rather than beside it.
Documented weights, with a permitted destination facility named, are the kind of evidence an auditor expects to see.
Local mandates ask a different question
Some Texas markets require diversion rather than reward reporting on it, and the evidence they ask for is different.
Austin's Universal Recycling Ordinance requires food-permitted businesses to give employees access to an organics diversion option, and to file a plan with the city each year documenting how the program runs. That plan covers the hauler contract, container sizes, counts and collection frequency, where containers sit indoors and outdoors, and how employees are trained. Multifamily properties above a set size carry their own composting access requirement under the same ordinance.
What the city asks for is evidence that a program exists and is being run, rather than a diversion percentage.
Your service records answer that, and we can advise on what applies in your market.
What this data does not do.
It's important to know where our data stops before you build a submission around it.
We measure the food waste we collect. We do not measure your total waste generation, so a diversion rate still requires a denominator from your hauler or from an audit.
Our data is not third-party assured. We weigh containers at pickup and report the measurement as recorded. Where a framework or an auditor requires external assurance, that is a separate exercise.
Composting is not impact-free. Collection, transport and processing all carry a footprint. What composting avoids is the methane the same material produces in a landfill.
The equivalency figures are built for communication rather than for an emissions inventory.
We do not complete your submission. We supply a measured input to it.
Setting up a program so the data is reportable.
Most of what makes diversion data usable in a report is decided before the first pickup.
Match site naming to your reporting boundary. If you report per building, set the program up per building. Renaming sites later can break year-over-year comparisons.
Confirm the data breaks down the way you report. A hospital system reports at system level while adoption varies campus by campus. A campus runs residence dining, retail dining and catering as separate operations. A portfolio reports per asset. Weighing at location level is what allows one submission to cover all of them.
Set your reporting year first and work backwards. Most frameworks require 12 months of data, and some require it by a fixed spring deadline.
Keep the contamination record. Our drivers photograph contamination at pickup and your account manager is notified the same day. That record is useful evidence of a program under active management.
Expect us to adjust your service level in the first weeks. We refine volume estimates against real weights, so treat the first month as a starting point rather than a baseline.
ESG reporting FAQs.
-
Yes, as activity data. Category 5 requires mass of waste by treatment method. We weigh every container at pickup and record it against its location, which is the figure that calculation needs. Use pounds diverted rather than the CO2 equivalency.
-
They are derived from the Waste Reduction Model (WARM), published by the United States Environmental Protection Agency (EPA) and freely available. WARM publishes factors per ton, and we convert them to a per-pound basis. For the tree figure, we combine WARM's separate deciduous and coniferous lifetime values and express the result as the annual uptake of a single average tree.
-
No. We weigh containers at pickup and report the measurement as recorded. Where a framework requires external assurance, that is a separate engagement.
-
No. It describes avoided impact, and the Greenhouse Gas Protocol (GHG Protocol) states that avoided emissions should be reported separately rather than deducted from an inventory. It belongs in the narrative alongside your inventory.
-
Yes. Composting counts as diversion under the Waste Performance prerequisite in LEED v4.1 Operations and Maintenance (O+M), which requires weight-based tracking across a full year or a waste audit conducted during the year.
-
Total weight diverted, converted to metric tonnes. Waste sits at OP 12 in the current version of the Sustainability Tracking, Assessment and Rating System (STARS) and at OP 18 for institutions still reporting under 2.2.
-
Yes. We record weights against the location they came from, and your dashboard compares locations. We set portfolio programs up with individual property data alongside a consolidated view.
-
Custom reporting is available on request, depending on your reporting need. Tell us the framework, the boundary and the period, and we can work with you to produce it.
-
We deliver material we collect to industrial composting facilities permitted by the Texas Commission on Environmental Quality (TCEQ) for aerobic processing, and custom reporting can name the destination.
-
In most cases yes. We measure the food waste we collect rather than everything your site discards, and a diversion rate requires the total. An audit or hauler data supplies the denominator.
Bring the framework and the deadline.
The decisions that make diversion data reportable are easier to get right at the start than to retrofit later. Tell us which framework you report against and when the submission is due, and we can set the program up so the figures line up the first time.


